Code anzeigen
library(sysfonts)
library(showtext)
library(thematic)
library(palmerpenguins)
library(tidyverse)
library(plotly)
library(echarts4r)
library(gganimate)library(sysfonts)
library(showtext)
library(thematic)
library(palmerpenguins)
library(tidyverse)
library(plotly)
library(echarts4r)
library(gganimate)daten <- penguins %>%
group_by(species) %>%
summarise(m_schnabellaenge = mean(bill_length_mm, na.rm = TRUE))daten %>%
ggplot(mapping = aes(x = reorder(species, m_schnabellaenge), y = m_schnabellaenge)) +
geom_col(fill = "#9FC131") +
labs(title = "Schnabellänge von drei Pinguinarten",
x = "Pinguinarten",
y = "Mittlere Schnabellänge") +
theme_dv()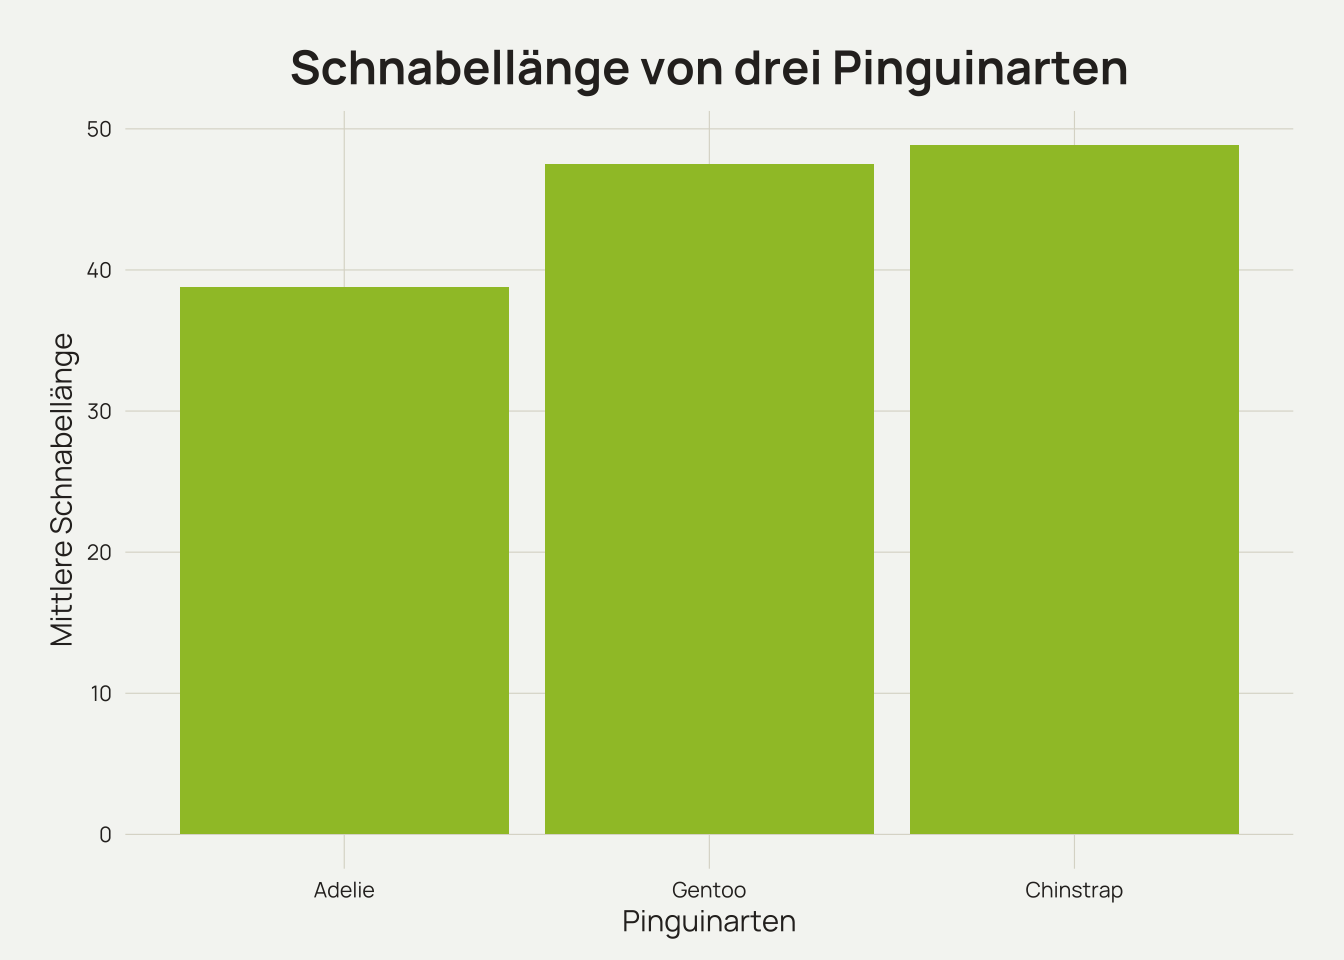
Alternativ ermöglicht die Funktion ggplotly() das Erstellen eines plotly-Objektes aus einem ggplot2-Plot.
plot_ly(data = daten,
        x = reorder(daten$species, daten$m_schnabellaenge),
        y = daten$m_schnabellaenge,
        type = "bar",
        color = I("#9FC131")) %>%
  layout(title =
           list(
             x = 0.055,
             y = 0.99,
             font = list(size = 22),
             text = "Schnabellänge von drei Pinguinarten"
           ),
    xaxis = list(title = "Pinguinarten"),
    yaxis = list(title = "Mittlere Schnabellänge"),
    font =
      list(
        family = "Manrope",
        size = "14pt",
        color = "#2d2926"
      ),
    paper_bgcolor = "#f5f5f2",
plot_bgcolor = "#f5f5f2")daten %>%
arrange(m_schnabellaenge) %>%
e_charts(x = species) %>%
e_bar(serie = m_schnabellaenge) %>%
e_axis_labels(x = "Pinguinarten",
y = "Mittlere Schnabellänge") %>%
e_theme_custom(theme = "theme/datenpfad.json") %>% # Optional Theme importieren
e_title(text = "Schnabellänge von drei Pinguinarten",
textStyle = list(fontWeight = 700,
fontSize = 22)) %>%
e_legend(left = "10%",
bottom = "0%",
orient = "horizontal") %>%
e_grid(top = "15%") %>%
e_x_axis(nameTextStyle = list(
color = "#2d2926",
fontSize = 14
)) %>%
e_y_axis(nameTextStyle = list(
color = "#2d2926",
fontSize = 14
)) %>%
e_tooltip(trigger = "axis",
axisPointer = list(type = "line")) %>%
e_toolbox_feature(feature = "saveAsImage",
backgroundColor = "#ffffff") %>%
e_toolbox_feature(feature = "restore") %>%
e_toolbox_feature(feature = "dataZoom")ggplot2_plot <-
daten %>%
ggplot(mapping = aes(x = reorder(species, m_schnabellaenge), y = m_schnabellaenge)) +
geom_col(fill = "#9FC131") +
labs(title = "Schnabellänge von drei Pinguinarten",
x = "Pinguinarten",
y = "Mittlere Schnabellänge") +
theme_dv_gganimate()
## Animation hinzufügen
ggplot2_plot +
transition_states(states = gruppe,
transition_length = 2,
state_length = 1) +
ease_aes("sine-in-out")